“Are you a math person? You look like a math person.”
Having submitted my dissertation for review, I find myself with some time on my hands. While many people have suggested that this would be an opportune moment to relax my father, who is also an academic, suggested that it merely freed up time to begin new projects! Write articles! Learn new skills! Having taken one morning off this week to drink cocoa and read a novel, I think I’m all done relaxing and ready to get started.
A few years ago, after a thrilling session on network analysis at the AHA, I decided that I was going to teach myself network analysis. That, much like undergraduate attempts in stat classes on linear regression analysis populated by econ majors, didn’t go quite as planned, and I mostly gave up and began to rely in IBM’s online ManyEyes software, which produces nice, if slightly clunky visual representations of data. But just yesterday, I received notice of Indiana University’s free MOOC on information visualization (referred to as IVMOOC, which is really quite fun to say), which is offered just when I need something to occupy my time/keep me from compulsively re-editing a document I’ve already turned in. The preliminary survey for the course suggests that it’s mostly geared towards people who already have data-driven backgrounds, so for the next eight weeks, I expect to feel much like I did when confronted with Chi-squared problems in my senior year of college – completely over my head, but having loads of fun.
At the same time, I also hope to get acquainted with the open source Quantum GIS software, which seems like it would be a pretty nifty way to deal with the map-making problems I’ve been confronting recently.
Also revising one article. Also writing another article about the movement of information in the mid-nineteenth century, which hopefully utilizes some of what I’ve picked up from IVMOOC and Quantum GIS.
At any rate, the enthusiasm made possible by my new-found time must have been obvious to the woman sitting next to me during my novel-reading/cocoa-drinking morning off. As she got up from her seat next to me at the cafe, she turned and said “Are you a math person? You look like a math person.” We’ll see.
Quick note on breakfast cereal
I love playing around with the idea of realizing different projects in different genres – exemplified for me, by Douglas Adams’ quip about starting a new project:
People wanted me to do a CD-ROM of Hitchhiker’s, and I thought, “no, no.” I didn’t want to just sort of reverse-engineer yet another thing from a book I’d already written. I think that the digital media are interesting enough in their own right to be worth originating something in. Because, really, the moment you have any idea, the second thought that enters your mind after the original idea is, “What is this? Is it a book, is it a movie, is it a this, is it a that, is it a short story, is it a breakfast cereal?” Really, from that moment, your decision about what kind of thing it is then determines how it develops. So something will be very, very different if it’s developed as a CD-ROM than if it’s developed as a book. (From an interview with the Onion AV club, reprinted in The Salmon of Doubt)
Well, the playwright Lucy Prebble just published a piece on the New York Times‘ ArtsBeat blog about gaming and narrative and form and argument. It’s quite good.
Quick note: “Snow Fall”
The New York Times has been pushing “Snow Fall,” a multimedia article about the February 2012 avalanche in the Cascade Mountains. It’s a six part story, much like one of the NYT Magazine‘s feature articles, but supplemented with video interviews, interactive maps, and other material designed to bring the story to life. It takes some time to get through, but is, I think, worth getting into, because it seems like one direction that newspapers might take in this “digital age” of reduced print circulation.
That being said, I’m not convinced that the story really needed all of the bells and whistles. The story itself – of 16 professional or semi-professional skiers caught in an avalanche – is compelling enough on its own. Interviews with survivors are heart-wrenching, but for me the most difficult part of the piece was the narrative reconstruction of the victims’ loved ones’ reactions. Many people are familiar with print analogues to stories like these – the Magazine’s story last week about Barney’s, for example – which could be augmented with digital material, and I suppose there’s an argument that says that the more information included, in as many different mediums as possible, the better. And some parts of “Snowfall” worked really well. As you read each part, the text scrolls over background images – in some cases of snow, in others of trees destroyed by the avalanche, and, perhaps most effectively, over maps which highlight the position of the skier being discussed at the moment. But in other places, the information feels superfluous, or not fully integrated – digital content for the sake of novelty, rather than for the sake of telling a better story.
I hope to see more of this kind of thing from the Times, because I think that it charts some rich terrain for the future of journalism (and I’d frankly love to play around with something like this for history writing). I also have to wonder whether some kinds of stories are suited to this treatment more than others. Because I’m a disaster studies nerd, I did find myself thinking that disasters are particularly well-suited to these kinds of pieces (I was actually reminded a couple of times of the “Murder on Beacon Hill” documentary and app – which, if you live in or near Boston, is really worth checking out). Disasters (or in the case of the Beacon Hill piece, murders) often feature a discrete cast of characters, a series of events easily fit into narrative form, and take place in a limited enough space to make things like maps useful. I’d really love to see the “Snowfall” treatment applied to a more data-driven story though, because I think a lot of great work has been done recently with visual and interactive representations of information that could really enhance readers’/viewers’ experience of a story.
Dream course
Despite the stress, one of the perks of being on the market is that I get to spend entire days sitting around and thinking about dream classes – not dream students, or dream institutions – but the classes I’d teach if I had all the leeway and resources in the world. It’s tremendous fun, and means that I occasionally stumble across brilliant and compelling work I’d not previously had a chance to explore. Today, that was Jill Lepore’s piece in the JAH on biography and microhistory. If you have institutional access, read it. It’s great.
I came to this by way of thinking about how to design a class that centered the historical challenges of reconstructing historical actors’ experiences – and particularly those of people who aren’t likely to have left a strong mark on the historical record. (An aside: at the Against Recovery conference hosted by NYU a few weeks ago, a number of people called for scholars of race, slavery and the enslaved to move beyond the language of “recovery” for accessing the historical experiences of the enslaved, the freed, and free people of color – it was a fascinating conference all around, but I especially loved how we were pushed to think about how the very words we use to describe historical practice privilege some narratives over others) My ideal version of this class combines Kathleen Conzen’s course at the U(C) on American immigration history, for which the final project asked us to use census records to track an immigrant family living in Chicago at some point in the past; Martha Hodes’s class at NYU on “Reconstructing Lives” which focuses on the craft of writing a history centered on one particular person – and the craft of historical writing more broadly. (Her “Four Episodes in Re-Creating a Life” beautifully illustrates the challenges inherent in this), and Nicholas Wolfe ‘s, also at NYU, which uses the 1860 census as a common data set and teaches old-school social history statistical analysis. I’m also captivated by the work that the folks at Zooniverse are doing in citizen science, though the New York Public did something similar in the humanities with its menu transcription project.
In an ideal world, I’d love to construct a class around a data set (say, for example, the Charleston donors I mapped yesterday) and ask each student to write a microhistory of one of them. Some are easier than others, though the ones that are most prominent might have a larger collection of extent personal papers, which is great for research, but perhaps stressful for already taxed undergraduates. We’d begin with tracking their donors through various censuses – probably using something like Ancestry.com – before branching out into other kinds of archival material. Once the students had built up biographical sketches of their donors, we’d move on to the social/cultural work that microhistory can do so well – using these people to tell us more about the world of antebellum South Carolina? Reading cultures in the antebellum South? Relationships between social status and philanthropic giving? I’d love to end the class – maybe the last third of the term – with a collaborative project, in which students come back together to write a history of their cohort, focusing on whatever has popped out for them as the important historical question that their donors’ lives help illuminate. I imagine that several iterations of a class like this would produce an archive of its own – a series of biographies, micrhohistories and essays that describe the data more completely than I’d ever hope to do on my own, and which students would be able to cite as examples of their public work as they move on from my class. In the most perfect of worlds, I’d be able to find a data set that is populated by people local to wherever I’m teaching, which would (hopefully) encourage students to get themselves to local archives, maybe speak to descendents, or even explore the lived environments of the people they’re researching.
As much as this would be a blast to teach (it’s archival! it’s historical methodology! it’s local history!) I also worry about deploying students in service of what, ultimately, are research goals that could help me out quite a bit. I like the idea of finding a population of people who share some attribute, beyond their physical location (though if the geographical confines were small enough, it might be interesting to also make this a class about community history) and I have this massive, 6,000+ data set of famine donors that I’m itching to work on, but I’m concerned about exploiting student labor in service of my own project. On the other hand, some of the papers that have come out of the citizen science work cite everyone who helped out with the project online, and science labs do this kind of thing all the time, and give students first or second authorship on the papers that come out of the research.
Off to write a dream syllabus.
Maps, maps and maps
I’ve been playing around with a data set of 95 donors whose names were published in the Charleston Mercury and Charleston Courier. I’m a data/census nerd, so there’s a lot of fun to be had with lists like these. So now I’ve got this database that tracks where donors lived, how much property they held, what jobs they held and how many enslaved people they owned. I’ve been plotting the donations with google maps, which is fine for showing just how widely appeals circulated, but doesn’t really do much else for visually describing the data.
[googlemaps https://maps.google.com/maps/ms?msa=0&msid=214677819635357292007.0004d08361291f904d1c3&ie=UTF8&ll=34.016263,-82.283671&spn=3.169364,6.305034&t=m&output=embed&w=425&h=350]
I’d love to do something more with this – either plotting the data on an older map, or figuring out some way to code the markers to indicate amount of donation, or slaveholding/non-slaveholding, or profession. A few years ago, after an AHA panel on network analysis, I decided that I was going to learn to code network diagrams over winter break. I’ve similar aspirations for learning GIS, but I’m not holding out hope for it being an easy, or quickly doable task.
Vicky
From the New Orleans Picayune of September 9th, 1850:
At a recent meeting of Irishmen in New York, among other matters, it was Resolved, that any person who thence shall toast or drink the health of Victoria – the Queen of the English – merits and shall receive, socially and politically, the disfavor and contempt of every Irishman.
Donor demography
An item titled “donor demography” is always on my to-do list – I have a database with the names of over 5,000 individuals and groups who gave to famine relief, and there always seems to be something more I could be doing with that data. I’ve been playing around with a sample of 120 American donors. Telling a story about these people is tricky.
The easiest, and most bloodless approach is a statistical one:
In a sample of 12o donors, the largest single donation came from the Society of Friends in Philadelphia, who in February of 1847 collected $7,200. The smallest donation was of $1, and came from a “Friend of Ireland” somewhere in the vicinity of Charleston. The average donation was $443, but the most commonly donated amount was $5. The median donation was $50, and the geographic distribution of this sample (drawn from Charleston and New York Newspapers) shows donors scattered across the United States.
Another approach is to break them up into smaller groups, say, professional men (doctors, lawyers, clergymen, judges and military officers); men whose names don’t indicate rank or profession; women; towns and groups of people, and write a speculative narrative about what might have prompted men or women of a certain type to give.
From February to May of 1847, professional men across the United States contributed to famine relief. Some, like the Reverend Jas. Dupree of Summerville, South Carolina, gave as little as $3, while others like Dr. Benjamin Waldo, gave as much as $200. In the 1850s, a skilled laborer could make, at most $300 in a year, so the doctor’s donation certainly, and Reverend Dupree’s donation possibly represented a sizable portion of their household income. A significant majority of these men worked with a church in some capacity, suggesting that frequent exposure to doctrines of virtue through charity might have effectively encouraged some to give. These men also would have had access to the dominant newspapers of the day – easily affording penny periodicals like the New York Sun or Charleston Courier – and would consequently have been exposed to many of the circulating ideas about Americans’ obligations to the suffering Irish.
Finally, one of these donors from one of these groups, say “Dr. Reynolds” of Camden, SC, might be used to extrapolate the possible charitable motivations of men.
This “Dr. Reynolds” could have been any one of three Reynolds men living in Camden in 1840 (or someone else entirely, who emigrated in the intervening seven years). All three Reynolds residents of Camden owned slaves.
There, the trail goes cold. I could, with infinite time and resources, track down all of the donors mentioned in the records of famine charities, and that’s actually something I aspire to do some day, but those people who are recoverable from mid-nineteenth-censuses will likely prove to be remarkable in some way – an uncommon name or profession, or living in an uncommon place – rendering them less than ideal examples of the average or exemplary donor. Ultimately, I’m not convinced that having the stories of five thousands individuals will tell me more than trying to make sense of the groups they belonged to, or how they identified in their communities, but I’m neither sure what the best way to tell their stories is.
The more [history] you learn, the more [history] you see
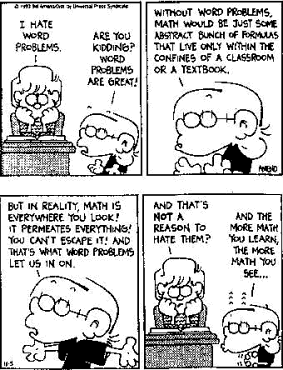
I’ve been throwing out variations on this line since I first saw this strip, and I’ve been having quite a few “the more history you learn…” moments in the past few weeks because of the hurricane.
On Saturday, the Press of Atlantic City reported that NOAA classified Sandy as a post-tropical cyclone right before it made landfall in NJ, a decision which is estimated to save homeowners/cost insurance companies millions of dollars in deductibles. NOAA isn’t a political body, but the classification is a fortuitous one for those facing insurance claims for their destroyed property, and it was echoed by NJ Governor Chris Christie when he issued an executive order prohibiting insurance companies from charging hurricane deductibles. (For a really fascinating discussion of the relationship between disasters and flood insurance, see parts II and III of Ted Steinberg’s Acts of God.) Though most of the article was about the impact of this call on insurance claims, the article briefly digresses into talking about what it means for a scientific body to be in charge – however indirectly – of a huge financial decision:
“If this was a court case, you’d have multiple meteorologists on the stand,” said Campbell H. Wallace, an attorney for the Professional Insurance Agents of New Jersey.
There is no court case. Insurance companies in New Jersey, New York and Connecticut have agreed to waive costly hurricane deductibles, which could have run in the millions of dollars along the three-state area.
Wallace said the insurance industry accepts the fact that the National Weather Service is “legally tasked” with making such determinations. He said meteorologists are judged by their peers and credibility is paramount to them.
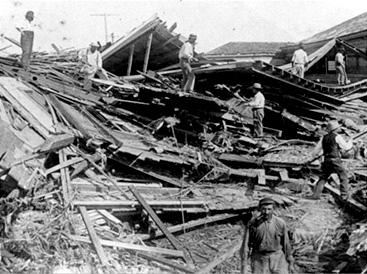
The Wallace quote reminds me of another apparently ancillary fact about the Atlantic hurricane – the Galveston Hurricane of 1900 which killed upwards of eight thousand people. Although meteorologists, both in the U.S. and in Cuba registered concerns about a storm headed for the Gulf of Mexico, the National Weather Bureau’s policy was to limit the use of the word “hurricane” in official correspondence, because it might engender widespread panic. On top of all of the other reasons for the high Galvestonian death toll (the misguided belief that hurricanes never struck that part of the Gulf, little way for ships to communicate observations from the middle of a storm, buildings that were particularly susceptible to storm damage) some of the blame must go, and has gone, to whomever made the decision that “hurricane” was just too dangerous a word for the American people.
In some ways, what is happening with insurance companies today is the flipside of what happened with the NWB and Galveston – in defining what counts as a hurricane, and what is “merely” a post-tropical cyclone (the two can be differentiated by as little as 1 mph difference in maximum wind speeds measured on the ground) the NOAA is saving – intentionally or no – thousands of people millions of dollars in total.
Categorizing Sandy
Hurricane Sandy happened two weeks ago – it (not she – because a lot of very smart people have written quite a bit about how oddly and quickly the violently gendered language around the hurricane spun out of control) decimated New Jersey and New York, particularly coastal communities along the Jersey Shore, barrier islands, Staten Island and the Rockaways. I’ve lived in New Jersey my entire life, and although the town I live in wasn’t particularly hard-hit, the emotional impact of the storm – even two weeks and a presidential election later – is still made manifest here.

I’ve been trying to think about how to write about this from the perspective of someone who studies disaster, and I keep coming back to the need to explain that I am from this place where this thing has happened – that I am not merely a distant observer of catastrophe. While I’m sure some of that impulse comes of not wanting to exploit a terrible thing in service of my own thoughts on an academic subject, I think that it also suggests something about the field – if there is one – of disaster studies – and maybe also something about how Sandy was reported until the Presidential election overshadowed all other news.
One of the things I open with when I teach disaster history is the degree to which disasters make for a fractured historical narrative. A number of quite interesting books have been written about individual disasters, but only a few historians – most notably Ted Steinberg – have tackled disasters as historical subjects. Jonathan Bergman has recently noted that “disaster studies have experienced some interesting developments and offer great lessons for historical scholarship, yet this reviewer is bedeviled by the suspicion that the subject has not formally ‘arrived’. Reconnaissances have been made, and initial volleys fired, but no scholarly introductions have been tendered on the historical field. Neither has there been a call for a sustained and rigorous discussion of its methods and values” I think, in part, that the very objects of study are deviations from the norm, and the experiences of people who lived through them are wildly divergent from their everyday lives.
This isn’t to say that disaster history doesn’t have ways of dealing with the fact that the things it studies are in many ways outside of everyday experiences. Some, including Steinberg, Mike Davis and Matthew Mulcahy, situate natural disasters in terms of the human circumstances that produce them. For the past few years, the classic example invoked to illustrate this point is Hurricane Katrina. In fact, the authors of the essays in There is No Such Thing as a Natural Disaster: Race, Class and Hurricane Katrina point out that it was the social conditions in New Orleans that killed so many people, rather than the eleventh named storm of the 2005 storm season – any major storm would have done the trick, as it were. Other scholars, particularly scientists who study natural hazards, have pushed back on this historicized or contextualist approach to disaster studies, noting that without catastrophic events, there are simply no disasters to study – they note that particular aspects of that particular storm were responsible for its “disasterousness.” However, whether we study the natural event itself – in the case of Sandy, a “post-tropical cyclone” – or, if we take the approach described by Alessa Johns as one in which, “If a disaster is defined as a physical phenomenon – an earthquake, a hurricane, or a flood, for example – affecting a human group adversely, then surely the activities of that human community, both before and after the event, require investigation,” a disruptive event is still at the center of the story. Put another way, both of these approaches lead to a field of disaster studies characterized by unique “firefly events,” rather than grand narratives.

This is a very long way of saying that the state of the field of disaster history mapped very closely onto what I experienced waiting for Sandy to hit, and experiencing its aftermath. People understood the possibility of disaster, but had little by way of a framework for approaching, anticipating or understanding it.
Both before and after the storm, commentators drew comparisons between Sandy and Katrina (largely in the context of Presidential responses). Others looked farther afield, positioning Sandy in terms of the 1938 hurricane, dubbed by some the “Long Island Express,” which had decimated much of New England, leaving high water marks that are still visible today. Commentators also reached for superlatives – “New York Subways Hit with the Worst Disaster in 108 Years”; “Ranks Among the Worst Economic Disasters”; and the Wikipedia article’s first paragraph casts Sandy as the largest Atlantic storm on record, the second most expensive Atlantic hurricane in history, and one of the strongest storms of all time. (Usual caveats about Wikipedia use apply here)
It seems like, short of comparing this terrible event to other terrible events, we have almost no rubric for understanding what happened. For those living through this, the conditions that lead to overbuilt beach communities, or a lack of effective dune screening, or any other structural cause don’t matter, and offer no perspective on loss. I think that some of these impressions must bleed over into the historiography, because the same comparative framing happens there too. While I’m absolutely committed to a deeply contextualized social, political and economic understanding of disaster, I also wonder if looking at patterns in aftermaths – in policy, or environmental change, or even demography – might be another way to understand disasters as part of a coherent field, rather than as sudden and disruptive events.
I was also struck by something a friend said to be over e-mail a few days after Sandy. He mentioned (I paraphrase) that he wondered if, as our possessions, houses and furniture become more and more similar/big-box/Ikea, that the aftermath of very different disasters wouldn’t start to look, and feel more and more the same. That might be the case from an outside perspective – the worst-hit parts of the Rockaways could certainly have been hit by a tornado or an earthquake – but so long as historical practice is rooted in using sources produced by people who lived through events, disaster history will always feel – to some degree – scattershot. The people telling us about these things did in the past, and are likely to continue to, describe them in exceptional and unique language, contextualizing them, if at all, in terms of other “worst,” “most expensive” and “most deadly” events. Given that, it’s easy to see why so many scholars, taking historical actors at their word, replicate that impression of disasters as disruptive, rather than the product of structures, in their own work.